Metrics
When submitting a Network Analysis Request via the Analysis API, two types of aggregate financial metrics can be requested.
The simplest of the two are specified in the form of Distribution Metrics which support common financial metrics like Value at Risk (VaR), Tail Value at Risk (TVaR), Window Metrics (Window VaR and others), Exceedance probabilities and others.
For details on Co Metrics, refer to Co Metrics.
Probability Windows
All metrics require the specification of one or more probability windows. Since the system does not currently support specifying return periods directly, this section covers the details of how to construct the equivalent windows.
Referring to the curve in example chart below, Graphene models loss as negative by default. For this reason values on the YLT curve are ordered from most negative (largest loss/smallest profit) to least negative (smallest loss/largest profit) as illustrated.
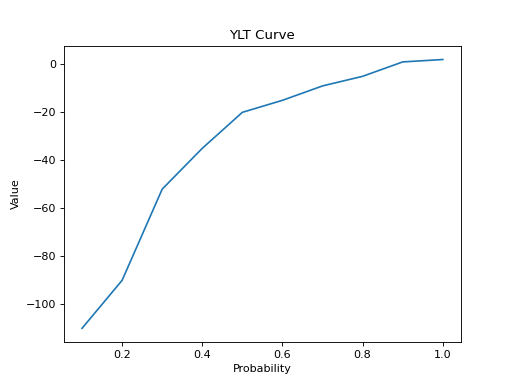
Since the example curve above is associated with a simulation of only 10 trials, suppose reports on the following return periods are desired:
1 in 10 (p=0.1)
1 in 5 (p=0.2)
1 in 2 (p=0.5)
Also suppose the following metrics are of interest: VaR, TVaR (for all return periods). The system will compute all of the necessary values for any statistical metric, so long the specific window(s) of interest are provided.
Here are the window inputs that correspond to the above return periods:
Return period |
window.min_probability |
window.max_probability |
|---|---|---|
1 in 10 |
0.0 |
0.1 |
1 in 5 |
0.0 |
0.2 |
1 in 2 |
0.0 |
0.5 |
The specific statistical outputs available are found in the ProbabilityWindowMetrics message, of which one instance is produced for every window specified. For the specific metrics of interest in this example, the corresponding fields are shown:
Metric |
Field |
|---|---|
Tail Value at Risk (TVaR) |
window_metric.mean |
Value at Risk (VaR) |
window_metric.max |
Special note about sign flipping
If losses have been modified in the business model to be represented as positive values, the YLT curve will be sorted in opposite order (profits would become negative for consistency). The “tail” of the curve (where the larger, less common loss years show up) will be found at the right. The system does not detect this case and does not modify its behaviour in this case. Graphene is agnostic to the treatment of positive and negative values and maintains the YLT curve order from most-negative to most-positive.
In this scenario, window ranges must be specified with window.min_probability used as the return-period-equivalent
probability and window.max_probability must be fixed at 1.0 since the largest values from a loss perspective will
be at the right. In the output, window_metric.min will represent the Value at Risk (VaR). Furthermore,
since window.min_probability is specified as an exclusive value, care is needed to adjust this value downward
slightly. This ensures the window range includes the probability associated with the return period of interest. For
example, given the 1 in 10 return period would land on the 0.9 probability (90th percentile in the default loss-negative
perspective, but 10th percentile in this flipped perspective), the expected arguments might be as follows:
window.min_probabilty=0.9
window.max_probabilty=1.0
Since the min_probabilty is exclusive, this does not include the probability 0.9 value (1 in 10) on the curve.
Specifying min_probability=0.899 instead is sufficient to include it. When simulation sizes rise to trial counts
in the thousands or hundreds of thousands, it is required to use even more precision - i.e. 0.8999999, but it is always
safe to be as precise as the field allows (double precision floating point).
Note
Graphene is agnostic to sign conventions with regard to YLT sorting
Note
Probability window ranges are specified with the min_probability being exclusive and the max_probability
being inclusive
Special note about probability windows
Since it is possible to specify ranges that do not include any points on the YLT curve, Graphene will report the most
conservative value (larger magnitude, or smaller percentile) to avoid under-reporting loss. In the example above,
suppose a probability window (min, max] is specified as (0.15, 0.16]. Since there are no points on the curve
that fall within this range, the system chooses the first value to the left of this window as the most conservative
result it can give. In this case, (from the example) window.min, window.max
and window.mean are all -110, because that is smallest value of the two adjacent to the window specified.
Note
In the case that a window is specified that does not include any points within the YLT curve, Graphene treats this as equivalent to a window that includes only the smallest of the (potentially two) values adjacent to the window. In practical terms, this is always the value to the left of the window, except when the window is already left of all the values on the curve (in which case the smallest value on the curve is picked instead).